Introduction
The share held by an individual mode of transportation in people’s mobility is called modal share. Modal share is an important data in city planning, urban development, subway route studies, and understanding the movements of people. In Japan, the share is calculated through a statistical method called “person trip survey”*1 based on interviews with commuters. Since this is a large-scale survey, it is conducted in Tokyo once every five years, with the latest data being from 2018. It is not possible to compare the statistics of every city in the world, as survey methods, targets, and granularity of transportation classifications differ according to the survey purpose and regional characteristics of cities. However, if we look at the statistics side by side, it allows us to determine the different characteristics of each city.
Modes of transportation are broadly classified into public transportation and private transportation. Public transportation is further divided into railroads, buses, taxis, and so on, while private transportation is also divided into automobiles, bicycles, walking, and so on. The following are examples for several cities.
Comparison of public transportation modal share in each city
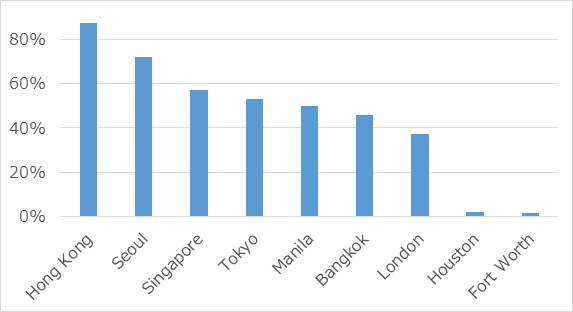
Graph 1. Transportation modal shares in cities
Figure 1 is a graph that shows the modal shares calculated for public transportation only, based on the data of each city. We can see from the graph that there’s a large difference between each city. For example, Hong Kong and Seoul have a public transportation share of 70% to 80% or more, while Houston and Fort Worth have only 1% to 2%.
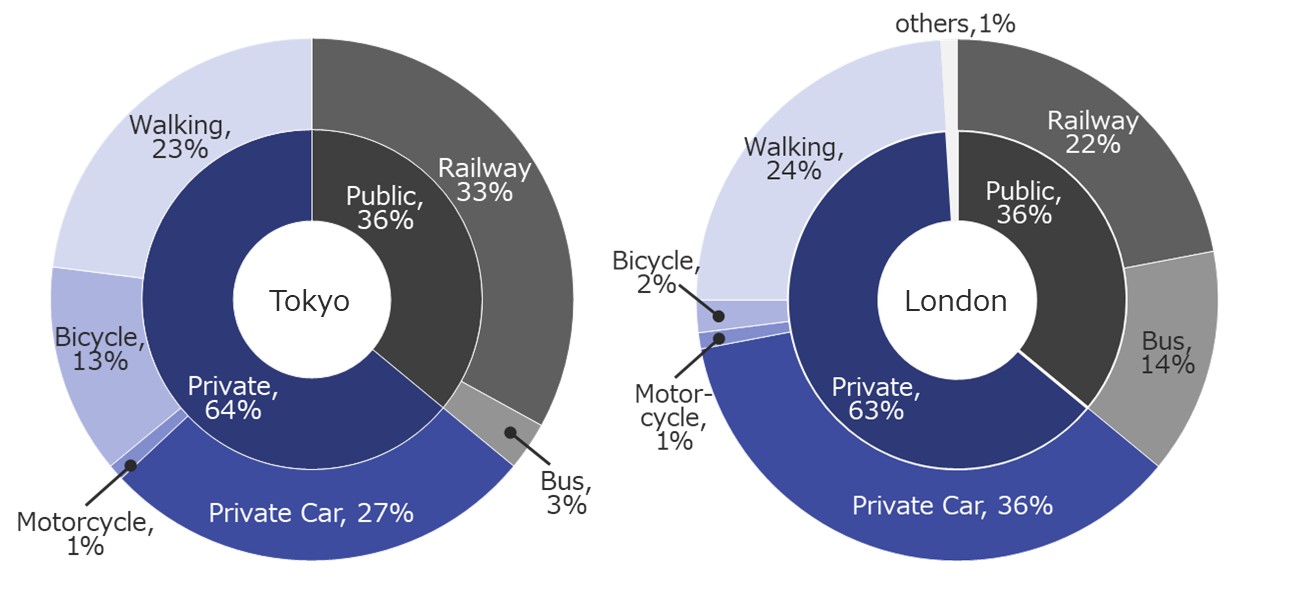
Graph 2 (left): Modal share in Tokyo; Graph 3 (right): Modal share in London
In Tokyo (the 23 Wards), public transportation modal share is 36% (33% for railways, 3% for buses), and private transportation modal share is 64% (27% for passenger cars, 1% for motorcycles, 13% for bicycles, 23% for walking). A key feature of Tokyo compared to other cities is its high modal share of railways within public transportation.
London’s public transportation modal share is 36%, the same as Tokyo’s, but the breakdown is 22% for railways and 14% for buses. This shows the significant presence of the London bus, a symbolic feature of the city operated and managed by Transport for London (TfL). At the same time, the 64% share for private transportation breaks down to 36% for private cars, 1% for motorcycles, 2% for bicycles, and 24% for walking.
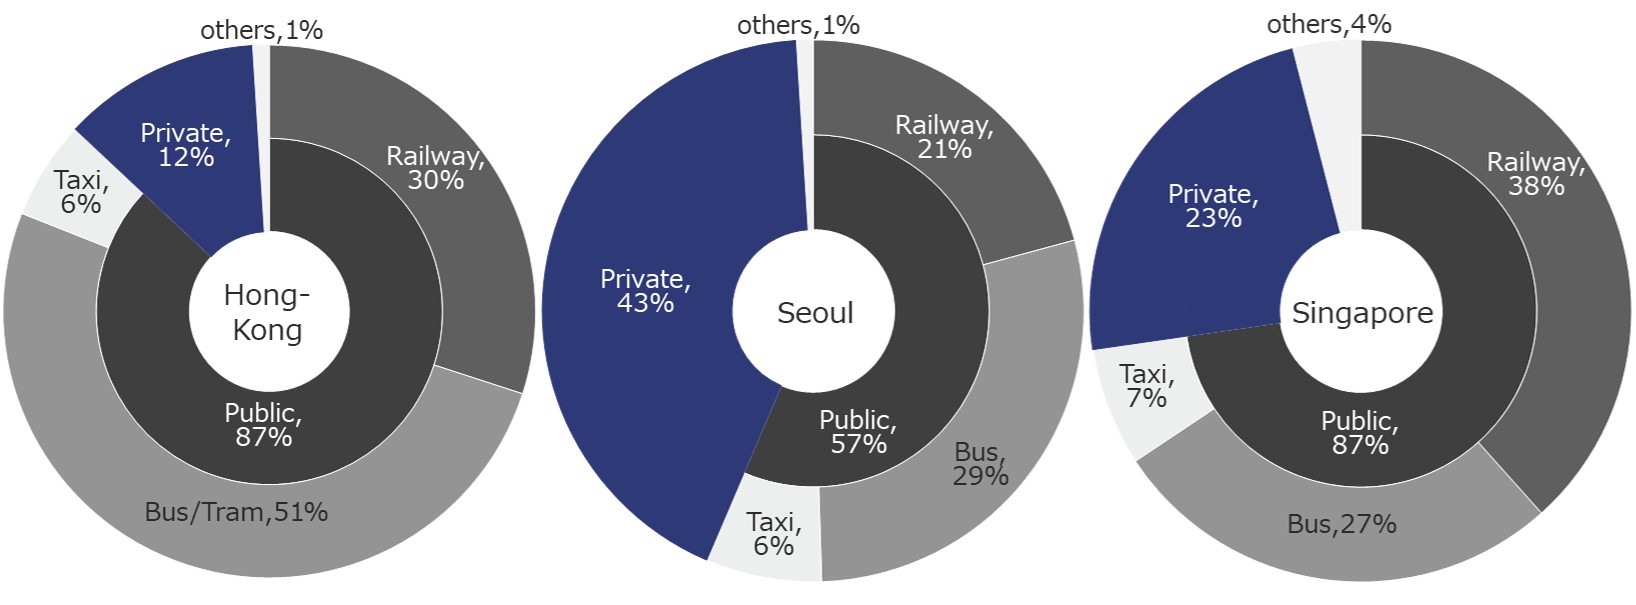
Left: Graph 4. Modal share in Hong Kong; Center: Graph 5. Modal share in Seoul; Right: Graph 6. Modal share in Singapore
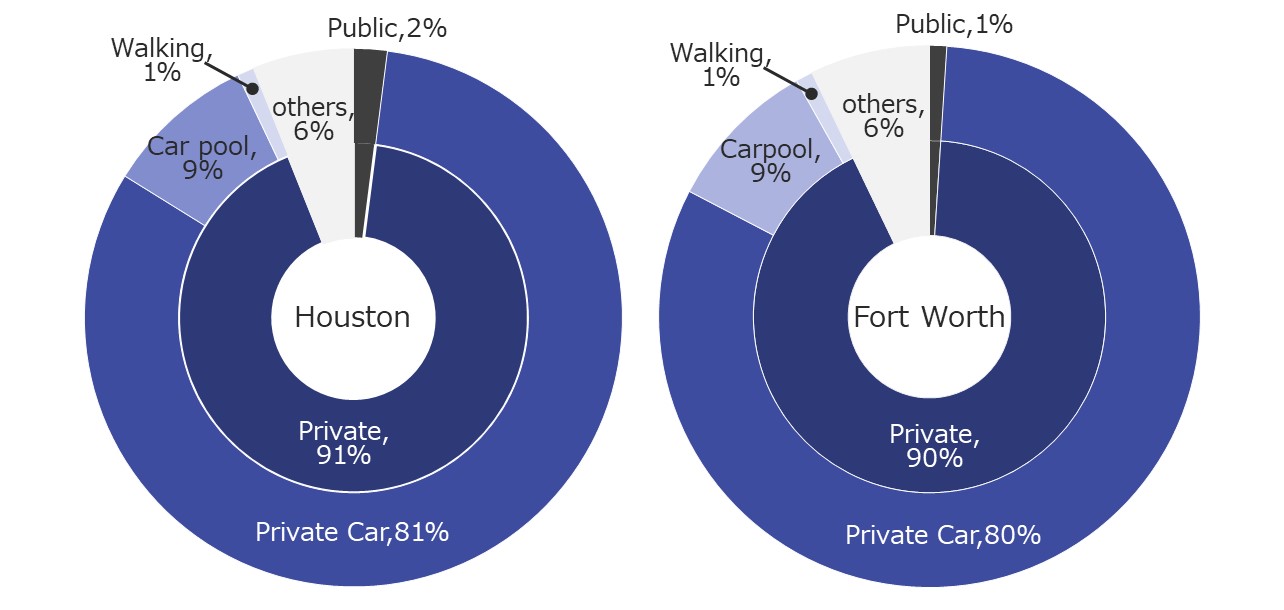
Left: Graph 7. Modal share in Houston; Right: Graph 8. Modal share in Fort Worth
Cities with high public transportation modal shares include Hong Kong (87%), the city-state of Singapore (57%), Seoul (72%), and others with high population densities. In contrast, Houston and Fort Worth in the United States are automobile society cities with extremely low public transportation modal shares of 1 to 2% and private cars accounts to about 90% (driving 80%, carpooling 10%).
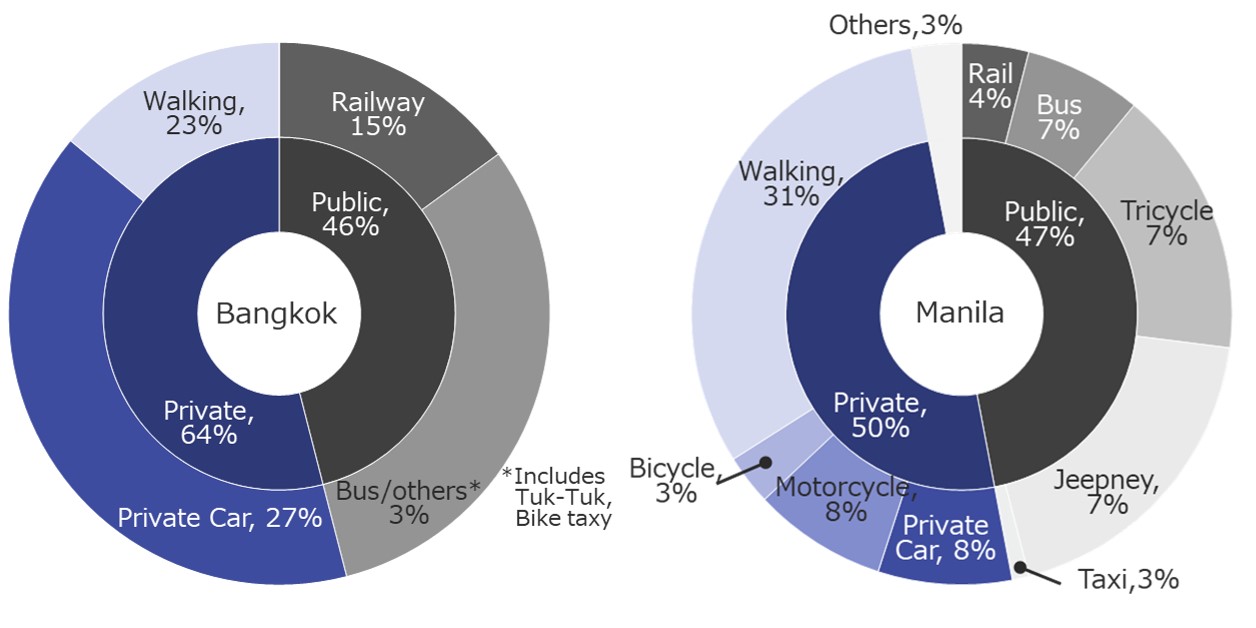
Graph 9 (left): Modal share in Bangkok; Graph 10 (right): Modal share in Manila
A look at Asian cities reveals different characteristics. In Bangkok and Manila, public transportation modal shares are high at 46% and 47% yet shares of railways are only 15% and 4%, respectively. The numbers include the three-wheeled taxi tuk-tuk famous among tourists as a unique form of public transportation in Bangkok, and the motorbike taxi used for commuting by Bangkok citizens. In Manila, sidecar-type tricycle taxis (16%) and shared-ride jeepney taxis (19%) have a large share.
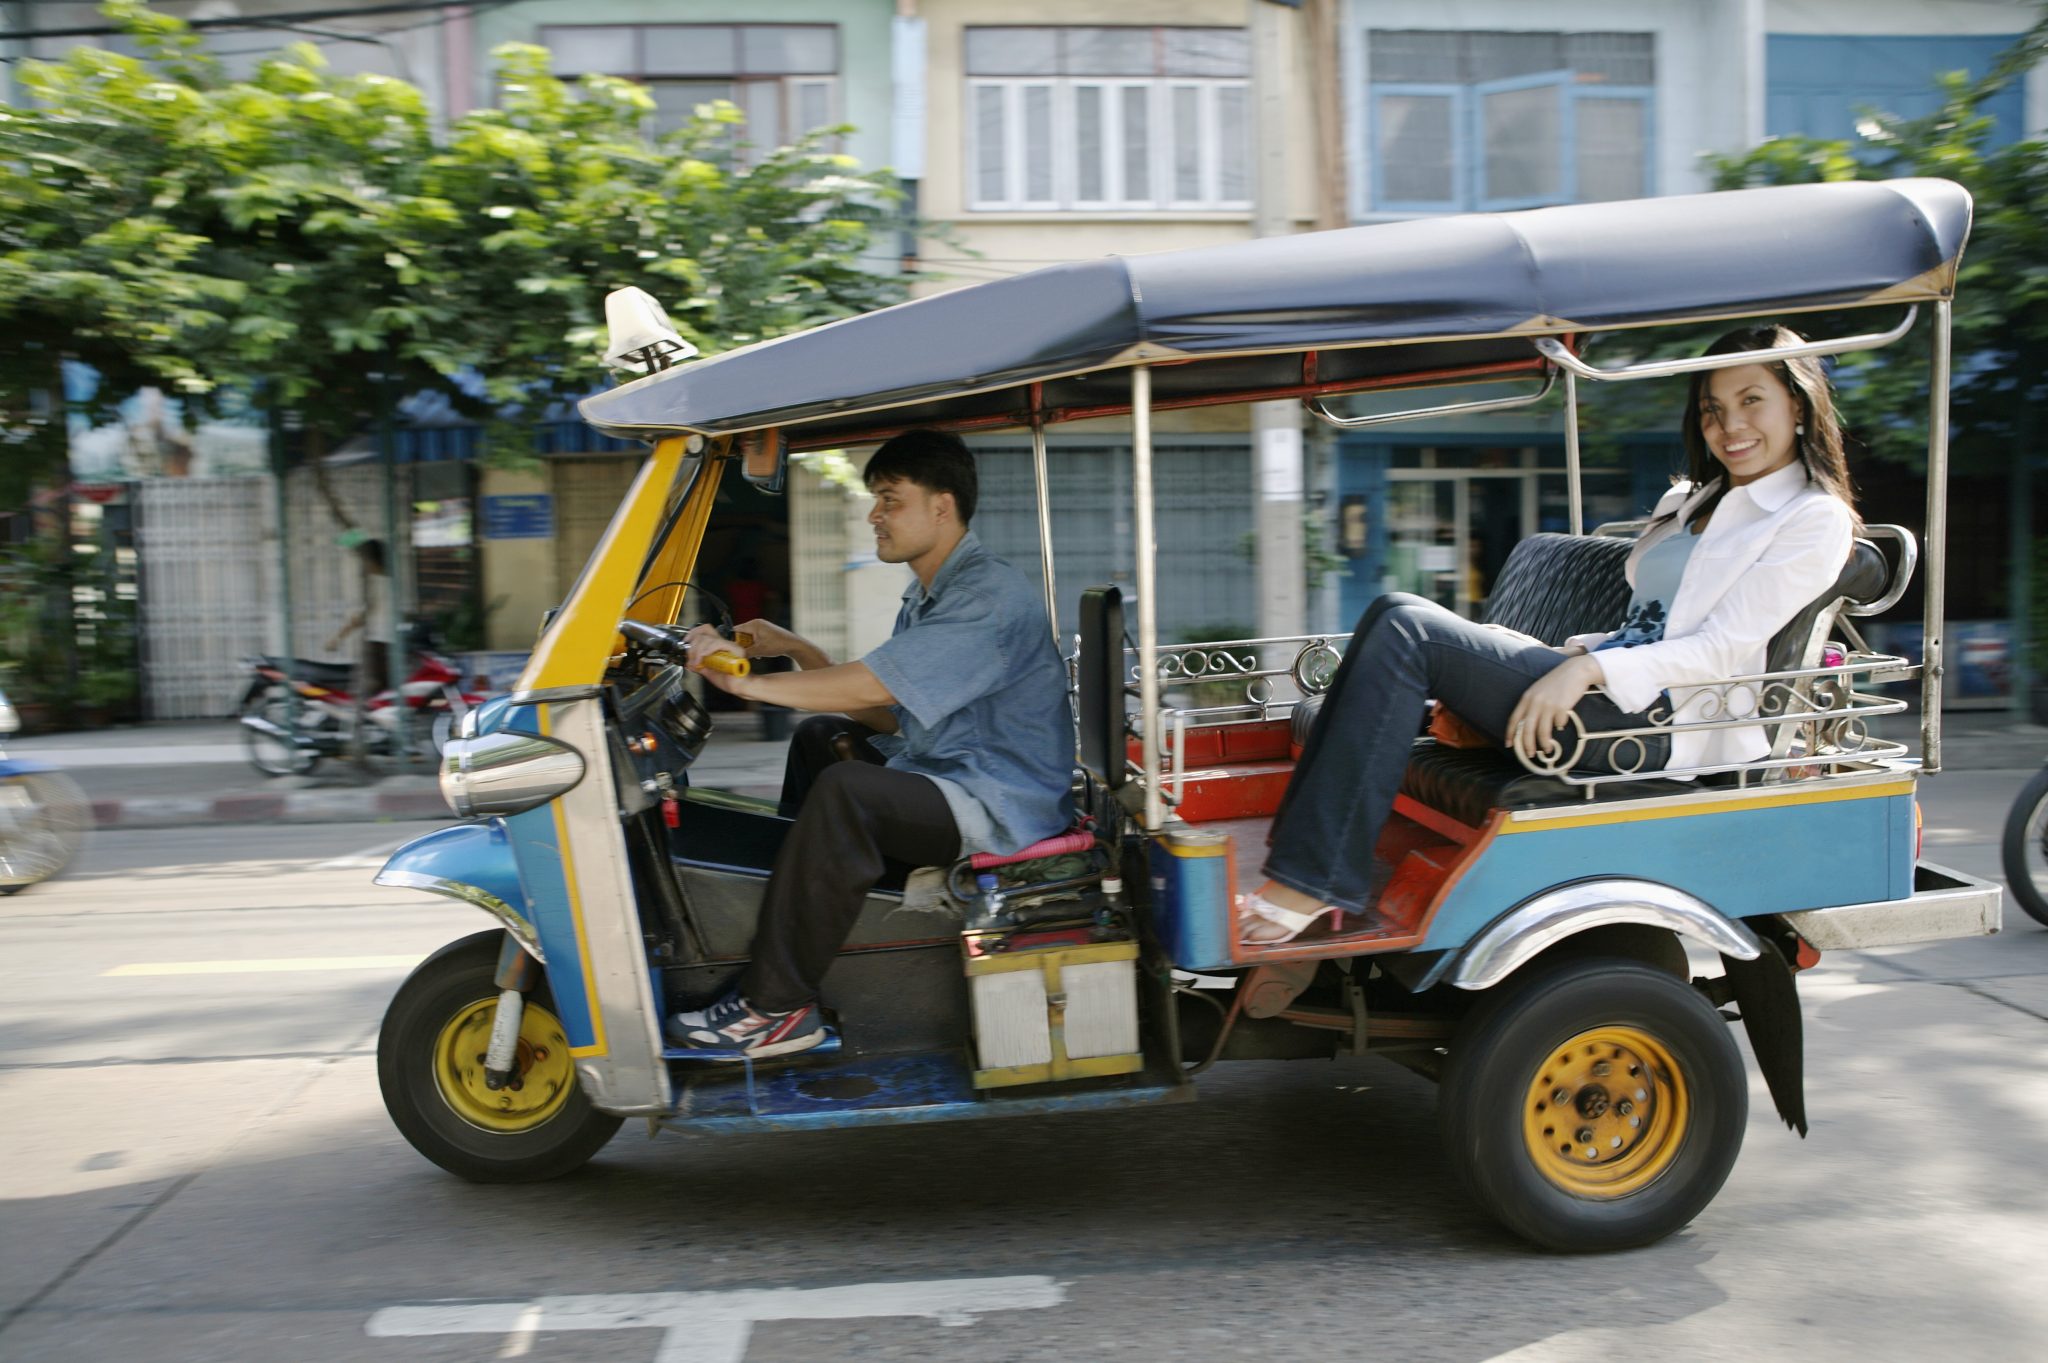
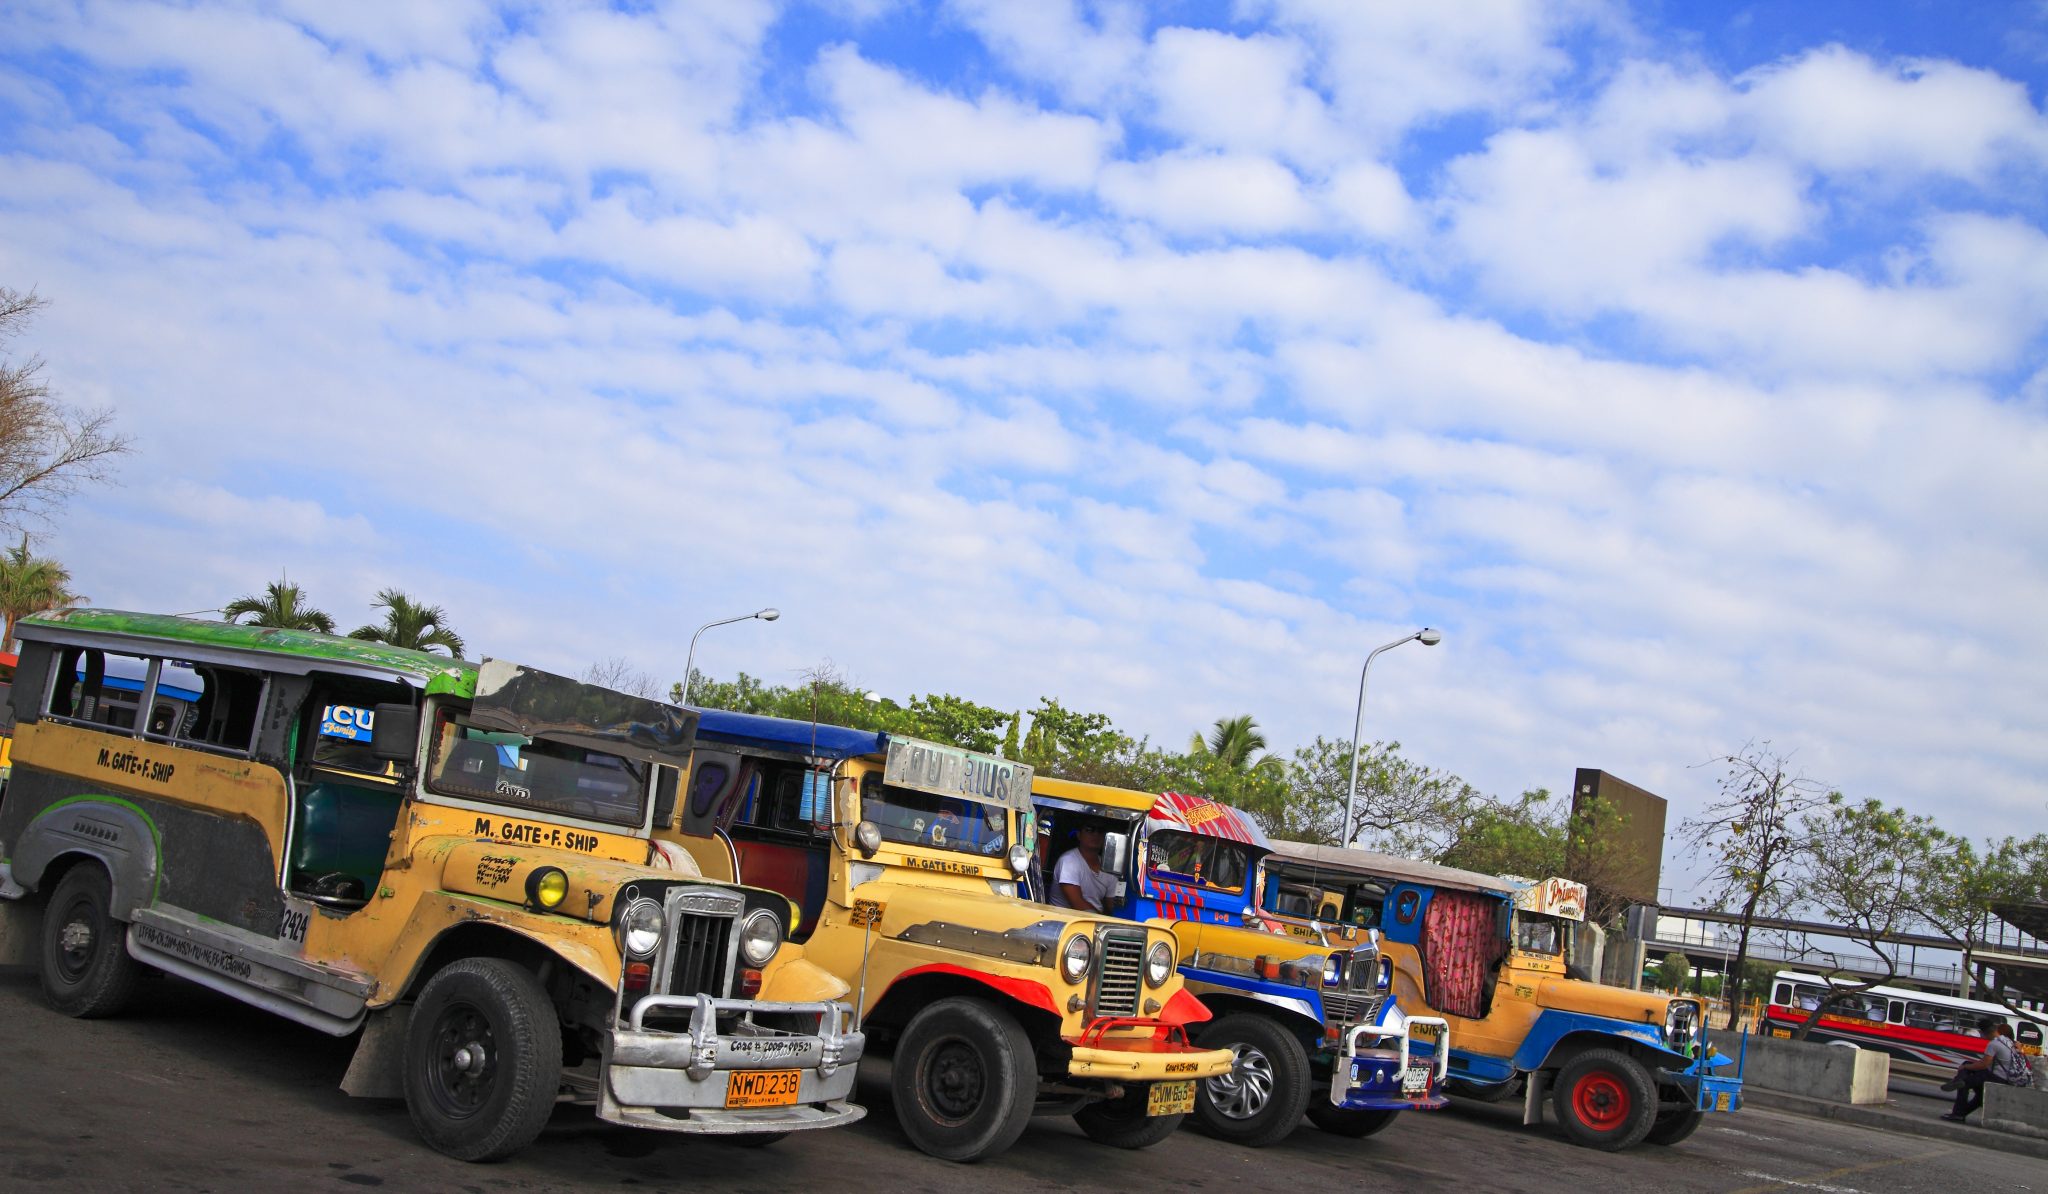
Left: Figure 1. Thai three-wheeled tuk-tuk taxi; Right: Figure 2. Philippine shared-ride jeepney buses
In this way, by examining the modal shares figures above, we are able to identify the traffic culture and characteristics of each city.
The proliferation of MaaS and changes caused by the COVID-19 pandemic
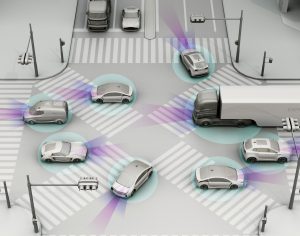
One major change seen in modes of transportation in recent years has been the growth of MaaS, such as Uber and Grab ride sharing and car sharing services. All of the city data above is statistical data collected at a time when the proliferation of ride hailing was still small. Under pandemic lockdowns, ride sharing and car sharing have been avoided as modes of transportation since it has a high risk of contagion, and their use has sharply decreased. In the future, however, these are expected to grow, with a balance struck between securing contagion prevention and social distancing, and greater efficiency of mobility. (Graph 11.)
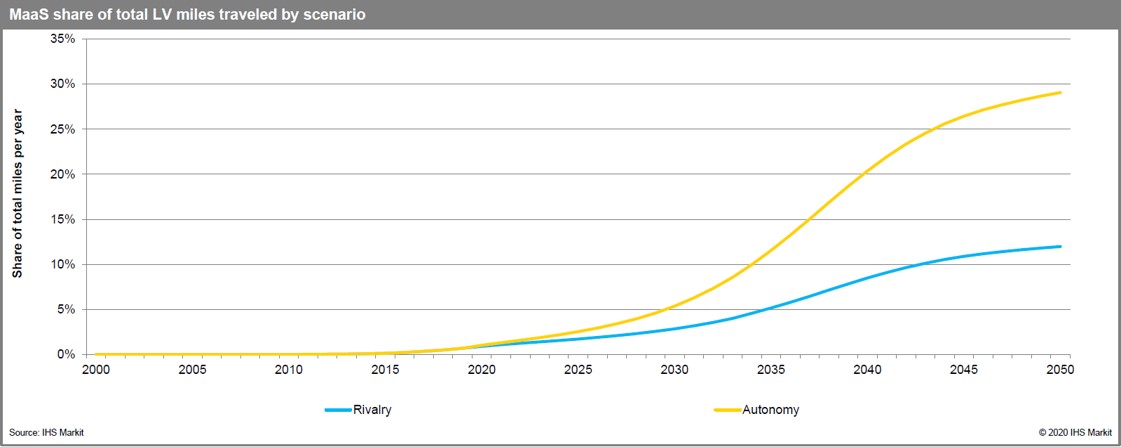
Graph 11. Forecast of the share of MaaS vehicles in VMT (Vehicle Miles Traveled)
In order for MaaS to further proliferate, relaxation of countries’ regulations on ride sharing and improvement of roads and traffic regulations to accommodate MaaS vehicles will be necessary. To avoid the use of public transportation during the pandemic, some cities have taken measures such as setting up dedicated lanes and car-free zones for bicycles and for micro-mobility, as alternative modes of transportation. If these measures take root as a new normal in the post-pandemic period, the proliferation of MaaS can be expected to accelerate.
However, as noted above, people’s modes of transportation vary by city. The proliferation of MaaS is progressing while allowing diversity to remain. That is, while multimodal MaaS *3 is progressing in cities with developed public transportation like London and New York, it will also progress in cities with underdeveloped public transportation, particularly railways, and where ride sharing has been spreading rapidly. Despite this, it is expected that the use of conventional modes of transportation like jeepneys in Manila and tuk-tuk in Thailand will still remain in these cities.
As of October 2020, many countries are still implementing immigration restrictions to prevent the spread of COVID-19. In the future after the pandemic, we can look forward to a day in which the traditional mobility of every city can be used with even greater convenience and efficiency.
*1 Person-trip survey: A survey focusing on the movement of people within cities. By asking for information on household and personal attributes together with daily travel information, the survey is able to grasp what sorts of people are moving from where to where at what time, by what modes of transportation, and for what purposes. As the survey focuses on people, it is able to grasp not only a single mode of transportation but also the status of connections among modes of transportation such as public transportation, passenger automobiles, bicycles, and walking.
*2 Two types exist: the base scenario (Rivalry Scenario) and a scenario in which autonomous driving and electrification of vehicles progress more aggressively (Autonomy Scenario). The share of MaaS is projected to increase in either scenario.
*3 Multimodal MaaS: MaaS (Mobility as a Service) combined with various types of transportation such as trains, buses, ride sharing service, and micro mobility.
Sources:
■ Transportation modal shares (Graphs 1 to 10)
Tokyo:
Ministry of Land, Infrastructure, Transport and Tourism, “Person-Trip Survey” (2018)
London:
Mayor of London, Travel in London Report 10 (2017)
Hong Kong, Singapore, Seoul:
Journey: Psassenger Transport Mode Shares in World Cities (2012)
Houston, Fort Worth:
U.S. Statistics Bureau, “Census Reporter 2019”
Bangkok:
LSE (London School of Economics) Cities
Manila:
Deutsche Gesellschaft für Internationale Zusammenarbeit
■ MaaS growth rate prediction graph (Graph 11)
IHS Markit :
Mobility and Energy Future, Light Vehicle Long Term update-2020